A React Component works hard. As the user manipulates the state of the application, it may re-render 5, 10, 100 times. Sometimes, that’s a good thing. But if you don’t understand what is causing the re-renders, and whether they are necessary, your app could suffer serious slowdown.
A Tale of Two Tables
A few months after I started at MuseFind, we embarked on a rewrite of our internal software. The key piece in this application was a table that allowed our customer success team to quickly edit, add, and manage collaborations across all influencer marketing campaigns on our platform.
The purpose of this rewrite was to improve our team’s efficiency — speed was the name of the game. But as the table grew in complexity (more and more subcomponents for each row, with inputs and date inputs and buttons), it became more and more slow. Slow to update, slow to reload — just a pain to use.
The solution was to carefully measure the render time of the subcomponents and of the table as a whole, and then begin experimenting. Over time, we managed to cut the table render time to a third of what it was.
In this article I’ll take you on a quick tour of React’s performance tools, and how to eliminate wasted renders.
Let’s get started.
Please note: react-addons-perf is not compatible with React 16. Use your DevTools timeline instead. More on that here.
How To Benchmark A React Component
We’ll use a simple example: an app that renders a list of 10,000 numbers.
Half the numbers in the list — 1 to 5,000- are simply generated by incrementing. The other half, in a separate array, are generated by incrementing and then multiplying by a number stored in the app’s state.
So if the this.state.multiplier is 2, the second array would be 2, 4, 6 … etc up to 10,000.
To change the multiplier from the default of 1, we click a button.
When clicking the button, only the second array of ListItems should re-render — only they are affected by the change. Yet we’re experiencing slowness, so we want to investigate whether everything is as it should be.
Measuring Update Time
We’ll start by installing React’s performance tools.
npm install --save-dev react-addons-perfAnd then we can import it in our App.js:
import Perf from 'react-addons-perf'There are four Perf functions that we care about:
- Perf.start(): start measuring performance.
- Perf.stop()
- Perf.printExclusive(): prints total rendering time for components.
- Perf.printWasted(): prints wasted renders- we’ll get to this shortly.
We want to start measuring render time before our component starts updating- before we call setState(). Then we can stop the measurement and print the results using the lifecycle method componentDidUpdate().
Here’s what our console will look like after clicking the button:

Our App renders took 94.75ms to render, and rendered only once.
Our ListItem component took 53.84ms, and rendered 10,000 times (this is including all instances of the components, not individual render time).
In the second table, we can see ‘wasted’ time — when the component re-rendered but nothing had actually changed.
We have 5,000 wasted ListItem renders. Not good.
These renders are ‘wasted’ in the sense that only the ListItems affected by the multiplier will have their render actually changed when we click the button. There’s no point in having them re-render.
Fixing Wasted Renders
Fortunately, React furnishes us with a handy lifecycle method called shouldComponentUpdate() for these types of situations.
It gives us fine-grained control of when our component will re-render.
We can check for certain conditions, returning a boolean that React uses to determine whether it will call render() on the component, or leave it as is.
Here’s what it would look like for ListItem:
If the text prop hasn’t changed, there’s no reason to change the component’s appearance via a re-render.
Note that we don’t use the nextState argument in shouldComponentUpdate()- I left it there for reference.
Now let’s re-run our Perf.

We’ve cut our total render time down by 30ms, and eliminated all wasteful renders.
Using Perf in the Real World
Most of the components you’ll be benchmarking won’t be nearly this simple. But the Perf tools are a valuable way to identify which components are problems.
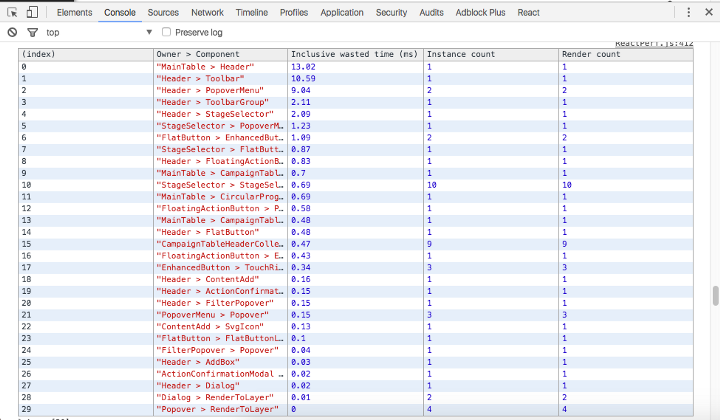
Here’s an example of Perf.printWasted() from MuseFind’s administrative table component:

These wasted times aren’t long at all, thankfully — but you can see that of the wasteful renders, the Header component is the main problem, with its subcomponents Toolbar and PopoverMenu accounting for almost all of the wasted render time.
Those two components are prime candidates for adding shouldComponentUpdate().
Bonus: Benchmarking Initial Renders
Sometimes you want to not just benchmark when the component updates, but also how long it takes to render completely the first time around.
In short, we want to measure the time between componentWillMount() and componentDidMount().
Perf.start() can’t be placed in the componentWillMount(), however, so we’ll have to be a little more manual.
This will give you a logged out time in milliseconds- not as fancy as Perf, but a useful metric for how long it takes to boot up your app.
Final Notes
As the docs page proudly proclaims, React is fast as it is.
However, that doesn’t mean it’s free from performance slowdowns caused by unnecessary re-renders — especially in complex apps with hundreds of children.
Using Perf on high-level components can give you an idea of which children are the problem, so you can keep your app quick and snappy.
I hope this article has been useful — if it has, let me know by hitting the green heart below.


